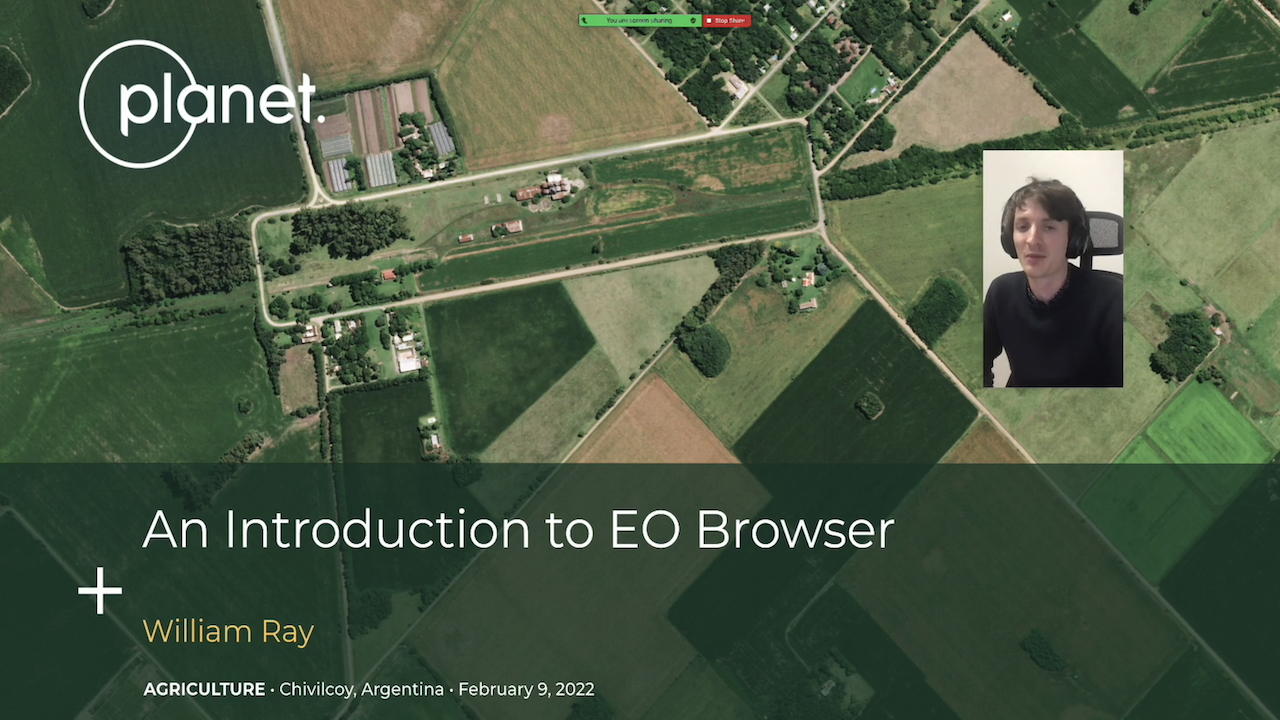
Introduction to the EO Browser on Sentinel Hub

Introduction to the EO Browser on Sentinel Hub

In this 20 minute course about Sentinel Hub, learn all about the functionalities of the Sentinel Hub EO Browser tool

rate limit

Code not recognized.

About this course

Get acquainted with the Sentinel Hub web tool, EO Browser. In this session we will cover how to visualize and manipulate satellite imagery datasets in-browser. We will discuss how to conduct time series and spectral analysis, as well as some of the current features and limitations relevant for Planet datasets. 

  1. View satellite imagery in the browser. 
  2. Apply basic visualizations. 
  3. Perform spectral analysis, and apply custom scripts on the fly (based on imagery).  
  4. View time series analysis, on custom AOIs
  5. Use navigational elements, such as zoom, create bounding box, and export coordinates
  6. Calculate AOI level statistics 
  7. Create, share and visualize pins
  8. Briefly introduce collections
  9. Discuss some current limitations, and expected functionality improvements, as well as opportunities for crowd-sourced contribution

Curriculum

  • Viewing Imagery and Apply Visualizations in the EO Browser
  • Time Series Analysis in the EO Browser
  • Using Analysis Tools in the EO Browser
  • Integrating Planet Data in the EO Browser
  • Viewing Planet Fusion Data in EO Browser
  • Creating Pins
  • Wrapping Up